Facts & Figures

Supply & Demand

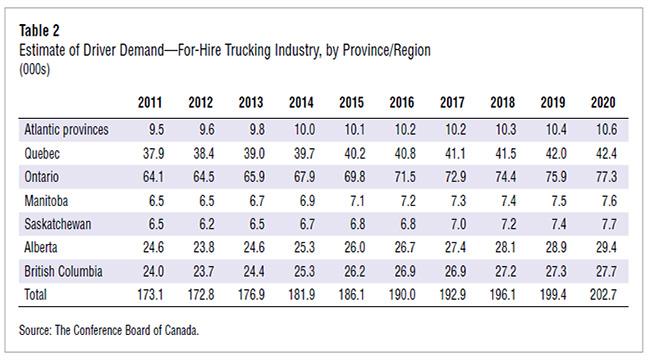
Supply-Demand Gap 2011-2020

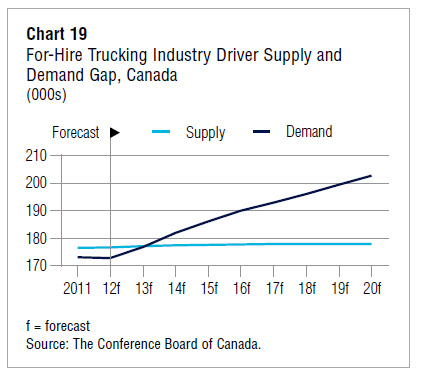
The  gap at the national level is about 25,000 (24,700) drivers by 2020—or about 14 per cent of the anticipated driver population—assuming year-over-year productivity increases of two-thirds of 1 per cent. A lower productivity performance, which is possible, would push the gap to over 33,000 drivers. As can be seen in the regional data, there […]

Click Here...

Estimated Driver Demand – By Province

Despite relatively strong increases in productivity from the industry over the past couple of decades, there is reason to believe that productivity gains in the future will be muted. While the industry benefited from deregulation and the opening of trade in the 1980s and 1990s, and while significant increases in size and weight regulations during […]

Click Here...

For-Hire Trucking GDP Growth

Given Canada’s relatively robust economic performance from 1999 to 2011, truck transportation has posted the strongest annual GDP growth among transportation segments. From 1999 to 2011, average annual compound growth in truck transportation GDP was 3.3 per cent, compared with 2.4 per cent per year for the aggregate transportation sector. (See Chart 22.) When the […]

Click Here...

Key Economic Indicators – Trucking Footprint

In 2011, real GDP in the for-hire trucking industry was valued at $16.96 billion, but its impact on our economy is far greater. The trucking sector provides benefits to the economy through the sales, jobs, and taxes generated by firms and sole proprietors operating in the sector. When including indirect and induced impacts, the sector […]

Click Here...